Image Details
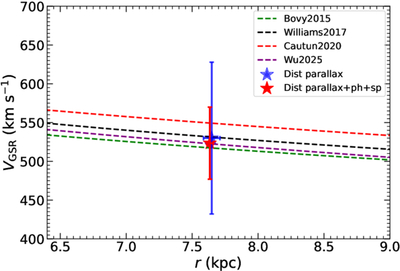
Caption: Figure 3.
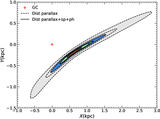
Galactocentric total velocity of DESI-HVS1 compared with escape velocity curves. The black dashed line shows the observed Galactic escape velocity curve from A. A. Williams et al. (2017). The green, red, and purple dashed lines correspond to predictions from the Galactic potential models (J. Bovy 2015, M. Cautun et al. 2020, and Y. Wu et al. 2025, respectively). The blue star shows the result obtained using the parallax-based distance (R = 7.65 ± 0.06 kpc, ﹩{V}_{{\rm{GSR}}}=53{0}_{-96}^{+100}\,{\rm{km}}\,{{\rm{s}}}^{-1}﹩), while the red star corresponds to the improved distance (R = 7.63 ± 0.03 kpc, ﹩{V}_{{\rm{GSR}}}=52{3}_{-47}^{+46}\,{\rm{km}}\,{{\rm{s}}}^{-1}﹩).
Other Images in This Article
Copyright and Terms & Conditions
© 2026. The Author(s). Published by the American Astronomical Society.