Image Details
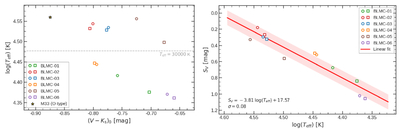
Caption: Figure 3.
(left) Color–temperature diagram for components of our systems. The colors clearly overlap, yet the temperatures of more massive O-type stars differ significantly from those of B-type ones. The position of the M33 O-type system is consistent with our O-type sample. (right) SB versus temperature. Although the scatter is higher, a common relation for O- and B-type stars can be derived.
Other Images in This Article
Copyright and Terms & Conditions
© 2026. The Author(s). Published by the American Astronomical Society.
Copyright ©
2026 Astronomy Image Explorer. All Rights Reserved.