Image Details
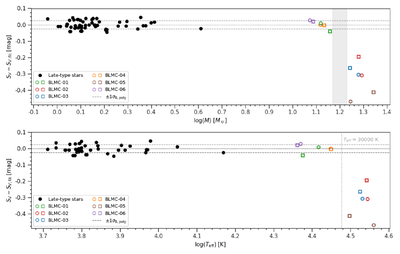
Caption: Figure 2.
SB residuals from the polynomial SBCR based on B-type stars versus stellar mass (top) and effective temperature (bottom). Our B- and O-type stars are plotted together with those of later types from D. Graczyk et al. (2021). O-type stars clearly deviate, although their ﹩{(V-{K}_{{\rm{s}}})}_{0}﹩ colors overlap significantly with those of B-type, and minimal extrapolation is needed. The shaded area marks a possible transition phase in mass between the B- and O-type stars. The effective temperature of 30,000 K also clearly separates the deviating stars.
Other Images in This Article
Copyright and Terms & Conditions
© 2026. The Author(s). Published by the American Astronomical Society.
Copyright ©
2026 Astronomy Image Explorer. All Rights Reserved.