Image Details
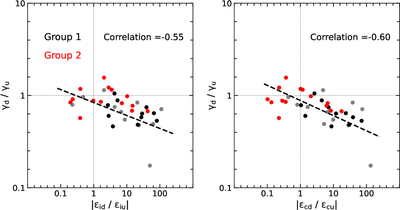
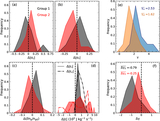
Caption: Figure 5.
Correlation between changes in the polytropic index and changes in incompressible (left) and compressible (right) turbulence cascade rates across shocks. The scatter points show the downstream-to-upstream ratios of the polytropic index and cascade rates for shocks in Group 1 (black), Group 2 (red), and neither group (gray). The dashed lines indicate linear fits, with the corresponding Pearson correlation coefficients shown in the figure.
Other Images in This Article
Copyright and Terms & Conditions
© 2026. The Author(s). Published by the American Astronomical Society.
Copyright ©
2026 Astronomy Image Explorer. All Rights Reserved.