Image Details
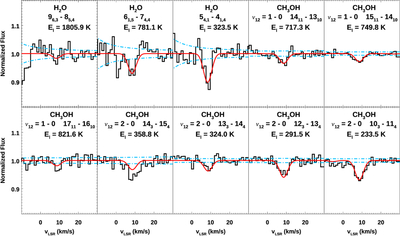
Caption: Figure 1.
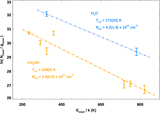
Observed H2O and CH3OH line profiles with the best-fitting LTE slab models overplotted in red. The dashed blue line indicates the 1σ flux uncertainty. In the H2O profiles, the nearby atmospheric water absorption causes the flux uncertainty to rise quickly toward lower velocities. The spectra has been binned by 3 pixels.
Other Images in This Article
Copyright and Terms & Conditions
© 2026. The Author(s). Published by the American Astronomical Society.
Copyright ©
2026 Astronomy Image Explorer. All Rights Reserved.