Image Details
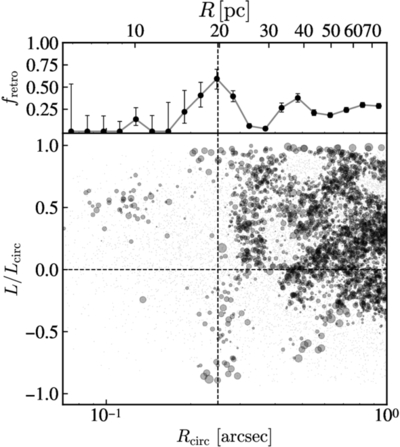
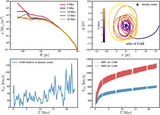
Caption: Figure 3.
Top: radial profile of the retrograde orbit fraction from the best-fit Schwarzschild model using the high-resolution orbit library (100,000 orbits). The vertical dashed line at 0﹩\mathop{.}\limits^{\unicode{x02033}}﹩25 ≃ 20 pc marks the boundary of the eccentric-disk region highlighted by the white rectangle in Figure 2. Bottom: distribution of orbits in phase space, showing the mean radius versus orbital circularity. The size of each circular marker scales with the relative weight of the corresponding orbit.
Other Images in This Article
Copyright and Terms & Conditions
© 2026. The Author(s). Published by the American Astronomical Society.
Copyright ©
2026 Astronomy Image Explorer. All Rights Reserved.