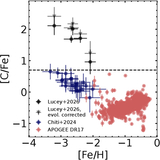
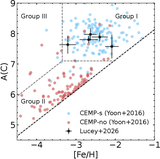
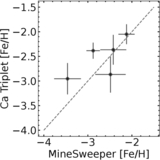
Image Details
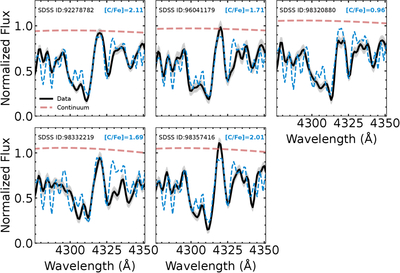
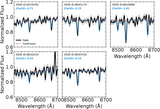
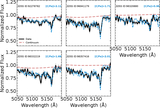
Caption: Figure 8.
The fits to the CH G band for the five CEMP stars. The black line with the gray shaded region gives the observed normalized flux and the corresponding uncertainty. The blue dashed lines are the best-fit synthetic spectra. As the fit is highly sensitive to the continuum normalization, we fit the model continuum to best match the observed spectra. The red dashed line gives the continuum normalization for the best-fit carbon abundance model.
Other Images in This Article
Copyright and Terms & Conditions
© 2026. The Author(s). Published by the American Astronomical Society.
Copyright ©
2026 Astronomy Image Explorer. All Rights Reserved.