Image Details
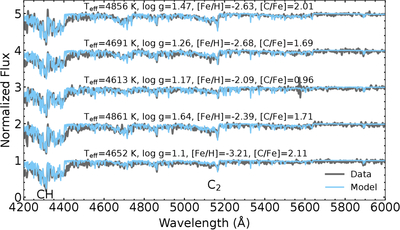
Caption: Figure 3.
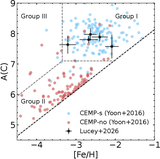
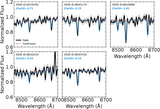
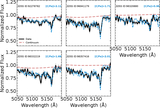
A region of the BOSS spectra (gray) for the five CEMP stars with the best-fit synthetic spectral model (blue) overlaid. The spectral models shown are used for fitting the carbon abundance while the Teff and log g are fixed to the MINESweeper parameters. This region contains the CH G band at 4305 Å and the C2 Swan bands, with the strongest feature at 5165 Å. The MINESweeper analysis also uses a subset of this region (4750–5550 Å) for the stellar parameter analysis with a mask for the C2 band at 5060–5180 Å.
Other Images in This Article
Copyright and Terms & Conditions
© 2026. The Author(s). Published by the American Astronomical Society.
Copyright ©
2026 Astronomy Image Explorer. All Rights Reserved.