Image Details
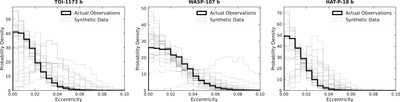
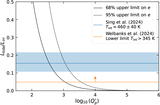
Caption: Figure 6.
The eccentricity posterior probability distribution for actual observed data (dark line) and 30 simulated datasets assuming circular orbits (light gray lines). These simulations indicate that our constraints are in line with those expected, given circular orbits and the quality of our data.
Other Images in This Article
Copyright and Terms & Conditions
© 2026. The Author(s). Published by the American Astronomical Society.
Copyright ©
2026 Astronomy Image Explorer. All Rights Reserved.