Image Details
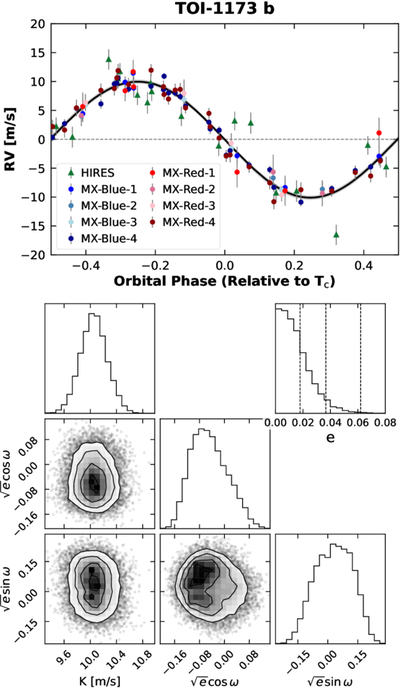
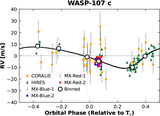
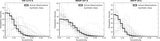
Caption: Figure 1.
Top: RV measurements of TOI-1173, phase-folded to the ephemeris for TOI-1173 b. Per-instrument offsets as well as a global RV trend have been subtracted from the data. The error bars represent the quadrature sum of the reported instrumental uncertainties and an additional RV jitter term unique for each instrument. The black line shows the maximum a posteriori model for the RV variation caused by TOI-1173 b, while the 1σ limits are shown in light gray. Bottom: corner plot showing the posterior distribution for the key RV fitted parameters K, ﹩\sqrt{e}\cos \omega ﹩, and ﹩\sqrt{e}\sin \omega ﹩. The inset panel shows the posterior distribution for the planet’s orbital eccentricity e, with vertical dashed lines denoting the 68%, 95%, and 99.7% upper limits.
Other Images in This Article
Copyright and Terms & Conditions
© 2026. The Author(s). Published by the American Astronomical Society.