Image Details
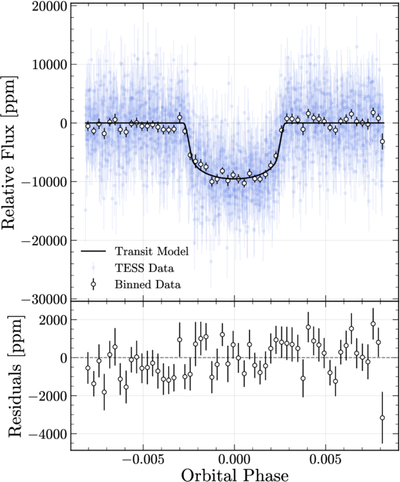
Caption: Figure 8.
Phase-folded TESS light curve of TOI-7019b from eight transit events observed in Sectors 14, 26, 40, 53, 55, 58, 81, and 85. The data are binned for clarity (white points), with the best-fit transit model from our joint analysis shown in black. The bottom panel shows the residuals after subtracting the best-fit model.
Other Images in This Article
Copyright and Terms & Conditions
© 2026. The Author(s). Published by the American Astronomical Society.
Copyright ©
2026 Astronomy Image Explorer. All Rights Reserved.