Image Details
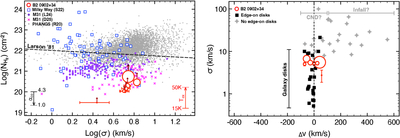
Caption: Figure 3.
Comparison to molecular clouds in the nearby Universe. Left: H2 column density plotted against velocity dispersion for molecular clouds detected in low-J CO(J+1, J) emission in the the Milky Way (A. Spilker et al. 2022, S22), M31 (C. J. Lada et al. 2024, L24; Y. Deng et al. 2025, D25), and nearby galaxies of the Physics at High Angular resolution in Nearby GalaxieS (PHANGS) survey (E. Rosolowsky et al. 2021, R21). For the emission-line work, ﹩{N}_{{{\rm{H}}}_{2}}﹩ is calculated from the cloud mass (M) and radius (R) as an average over a projected circular area, assuming a uniform volume density and spherical cloud geometry, following ﹩{N}_{{{\rm{H}}}_{2}}﹩ = M/(πR2). All mass values are scaled to a mass-to-light ratio of αCO = 4.3 (A. D. Bolatto et al. 2013), with the PHANGS result including an additional dependence on local metallicity (E. Rosolowsky et al. 2021). The red circles show the CO(0–1) absorption components of B2 0902+34, with their size scaled to the integrated line flux (Table 1). The dashed black line shows the correlation derived from Larson’s scaling relations between σ, R, and M (R. B. Larson 1981). The arrow at the bottom-left (right) corner shows how the emission (absorption) data decrease (increase) in value when αCO (Tex) changes from 4.3 to 1.0 (15 to 50 K). Right: velocity dispersion plotted against the velocity offset from the systemic redshift for molecular absorption components in nearby galaxies, for which also the molecular emission is observed (from T. Rose et al. 2024, including data from T. Rose et al. 2020 and T. Wiklind & F. Combes 1997). Black squares are absorption components found in galaxies with large-scale, edge-on (45° < i ≤ 90°) molecular disks. Gray stars are absorption features in galaxies lacking an edge-on disk and likely represent a combination of circumnuclear disks (CND) and infalling gas (see T. Rose et al. 2024). Red circles show the absorption in B2 0902+34.
Other Images in This Article
Copyright and Terms & Conditions
© 2026. The Author(s). Published by the American Astronomical Society.