Image Details
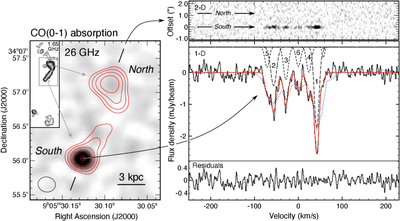
Caption: Figure 1.
CO(0–1) absorption in B2 0902+34. Left: contours of the 26 GHz radio continuum overlaid onto a total intensity image of the CO(0–1) absorption across the velocity range -80–55 km s−1. Contour levels start at 0.5 mJy beam−1 and increase by a factor of 2. The inset at the top left shows the 1.65 GHz map from C. L. Carilli (1995), which reveals additional large-scale emission that our 26 GHz data do not detect (credit: C. L. Carilli 1995, reproduced with permission © ESO). Right: CO(0–1) spectrum. The top panel shows a two-dimensional spectrum along the radio axis, crossing both the southern and northern 26 GHz component. The molecular clouds seen against the southern component are resolved spectrally but not spatially. The middle panel shows the one-dimensional CO(0–1) spectrum taken against the peak of the southern 26 GHz radio component. The spectrum is Hanning smoothed (Section 2) and has an rms noise of 0.15 mJy beam−1 chan−1 across the line-free channels. The red line represents a combined fit of seven Gaussian components (dashed lines). The blue dotted line is the low-resolution spectrum from B. H. C. Emonts et al. (2024). The bottom panel shows the residuals after subtracting the model from the spectrum, which are consistent with noise.
Other Images in This Article
Copyright and Terms & Conditions
© 2026. The Author(s). Published by the American Astronomical Society.