Image Details
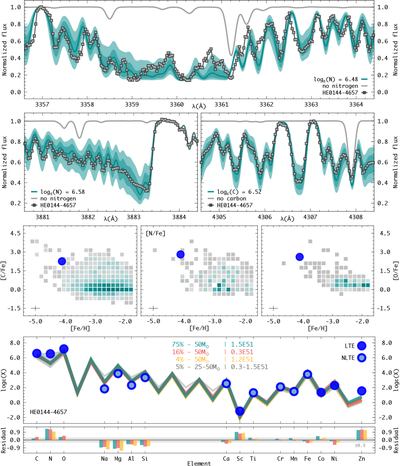
Caption: Figure 2.
First and second rows: abundance determination via spectral synthesis for nitrogen and carbon. The filled gray squares connected by the black line represent the MIKE spectrum, the teal line is the best fit, and the shaded regions represent ± 0.15 and ± 0.30 dex from the best-fit abundance. Also shown is a synthetic spectrum without carbon and nitrogen (gray line). Third row from the top: selected LTE [X/Fe] abundance ratios as a function of [Fe/H] for HE 0144−4657 (blue circle), compared with the JINAbase (A. Abohalima & A. Frebel 2018) and SAGA (T. Suda et al. 2008) literature compilations (density map). Additional references include G. Limberg et al. (2025) and V. M. Placco et al. (2025). Bottom panel: light-element abundance pattern for HE 0144−4657 (LTE and NLTE—blue points), compared with Population III supernova yields (solid lines, residuals given as vertical colored bars). See text for details.
Other Images in This Article
Copyright and Terms & Conditions
© 2026. The Author(s). Published by the American Astronomical Society.