Image Details
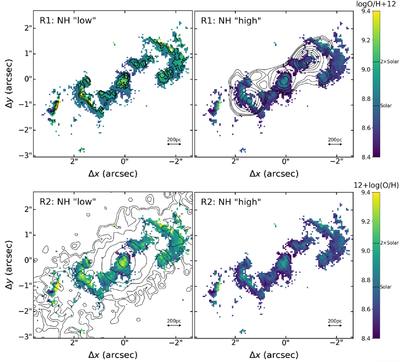
Caption: Figure 2.
Metallicity (﹩{\rm{log}}({\rm{O}}/{\rm{H}})+12﹩) maps calculated for AGN-type regions, based on R1 (upper row) and R2 (lower row) metallicity diagnostics and assuming low (left panels) and high (right panels) nitrogen scaling relations. Black contours trace SLI value on the top-left panel, 6 cm radio jet/radio-lobes emission, and soft (0.3–2.0 keV) Chandra X-ray emission in the bottom-left panel. Dashed lines on the color scale mark solar and 2 × solar abundances (assuming ﹩12+{\rm{log}}({\rm{O}}/{\rm{H}})=8.75﹩ for the solar value; M. Bergemann et al. 2021).
Other Images in This Article
Copyright and Terms & Conditions
© 2026. The Author(s). Published by the American Astronomical Society.
Copyright ©
2026 Astronomy Image Explorer. All Rights Reserved.