Image Details
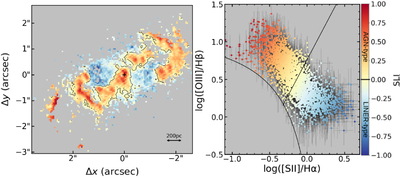
Caption: Figure 1.
SLI map and diagram for Mrk 573. Left panel: SLI map, with colors reflecting SLI values, i.e., the distance of each pixel from the Seyfert/LINER division line in the VO diagram. Black contours trace points on the Seyfert/LINER division line (SLI = 0). The black “X” marks the position of the nucleus. Right panel: corresponding VO diagram, with red indicating Seyfert-like excitation and blue denoting LINER-like excitation. The color intensity scales with the SLI value.
Other Images in This Article

Copyright and Terms & Conditions
© 2026. The Author(s). Published by the American Astronomical Society.
Copyright ©
2026 Astronomy Image Explorer. All Rights Reserved.