Image Details
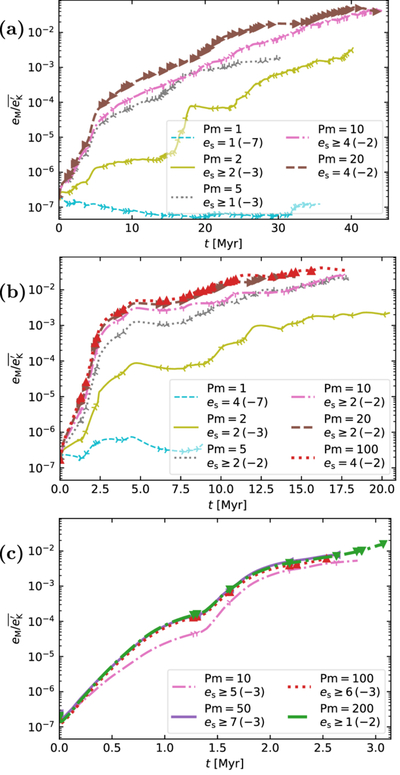
Caption: Figure 3.
Magnetic energy eM normalized by time-averaged turbulent kinetic energy ﹩\bar{{e}_{{\rm{K}}}^{{\prime} }}﹩ for grid sizes (a) 5123, (b) 10243, and (c) 20483 zones. See the legends for Pm and saturation energy es from an average over the final 2.5% of simulation time. Markers are shown at the time of SN explosions. Note that the timescales are dramatically smaller at higher resolution.
Other Images in This Article
Copyright and Terms & Conditions
© 2026. The Author(s). Published by the American Astronomical Society.
Copyright ©
2026 Astronomy Image Explorer. All Rights Reserved.