Image Details
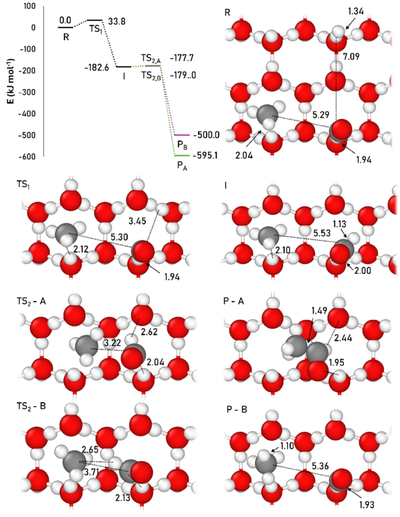
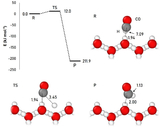
Caption: Figure 7.
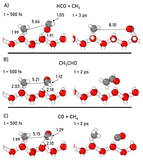
Top views of the optimized geometries of the stationary points along the PES for CO hydrogenation and the subsequent reactions with the CH3 radical. The PES profile is also shown for clarity. Distances are given in Å and relative potential energies in kJ mol−1. Color-coding: white, H atoms; red, O atoms; gray, C atoms.
Other Images in This Article
Copyright and Terms & Conditions
© 2026. The Author(s). Published by the American Astronomical Society.
Copyright ©
2026 Astronomy Image Explorer. All Rights Reserved.