Image Details
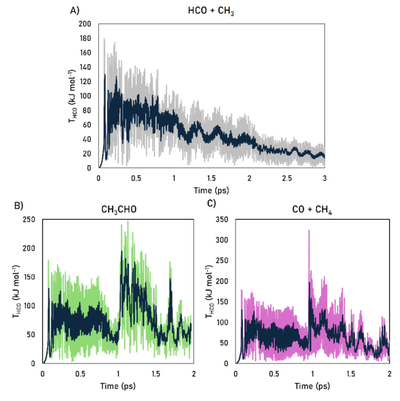
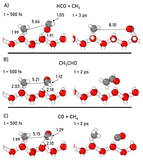
Caption: Figure 4.
Kinetic energy evolution of the HCO radical during AIMD simulations at a starting temperature of 10 K. Panel (A) shows a trajectory in which only HCO is formed; panel (B) corresponds to CH3CHO formation; and panel (C) to CO and CH4 formation. The plots display the instantaneous kinetic energy of HCO (THCO), with averaged values shown in black, computed every 20 steps.
Other Images in This Article
Copyright and Terms & Conditions
© 2026. The Author(s). Published by the American Astronomical Society.
Copyright ©
2026 Astronomy Image Explorer. All Rights Reserved.