Image Details
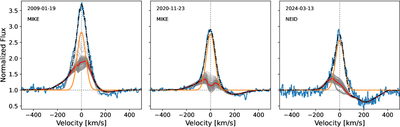
Caption: Figure 4.
Hα profiles of CVSO 1942 across 15 yr. The blue lines represent the observations, the red lines represent the average magnetospheric model, and the gray lines represent the top 100 best-fit models. The orange lines are the average chromospheric models, and the black lines are the average total models.
Other Images in This Article
Copyright and Terms & Conditions
© 2026. The Author(s). Published by the American Astronomical Society.
Copyright ©
2026 Astronomy Image Explorer. All Rights Reserved.