Image Details
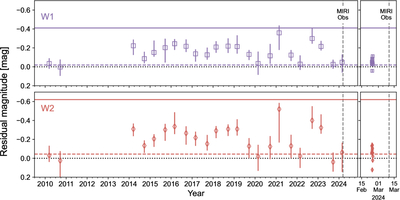
Caption: Figure 2.
Left: the light curve of CVSO 1942 from the ALLWISE (2010–2011) and NEOWISE (2014-2024) survey. The photosphere has been subtracted. The horizontal lines indicate the levels extrapolated by the models that fit the 2005 Spitzer observation (dashed lines) and the 2024 JWST observation (solid lines). The horizontal dotted lines show the photospheric level, and the vertical dashed line shows the date of the JWST observation, which was 2 weeks after the last NEOWISE observation. The data points are binned to 7 days. Right: the zoom-in, unbinned light curve of the star around the JWST observation.
Other Images in This Article
Copyright and Terms & Conditions
© 2026. The Author(s). Published by the American Astronomical Society.
Copyright ©
2026 Astronomy Image Explorer. All Rights Reserved.