Image Details
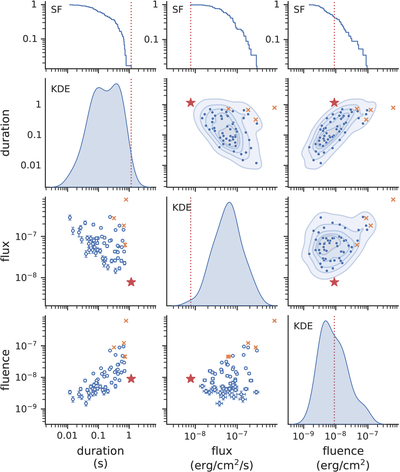
Caption: Figure 4.
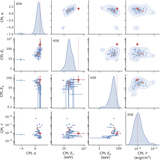
The distribution and correlation of duration, fluence, and flux of 60 bursts from the selected model. The red star and red dashed line represent the RB-MXB 221021. The crosses in each panel represent the unreliable results due to the saturation of the HE telescope.
Other Images in This Article
Copyright and Terms & Conditions
© 2026. The Author(s). Published by the American Astronomical Society.
Copyright ©
2026 Astronomy Image Explorer. All Rights Reserved.