Image Details
Caption: Figure 1.
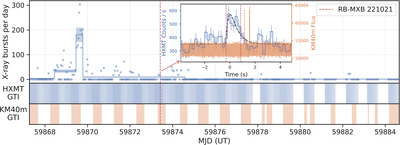
The joint observation history of SGR J1935 by HXMT and KM40m. The red dashed line indicates the occurrence of the MXB 221021 associated with RB 221021. For the temporal comparison, the HXMT and KM40m event times shown here have been converted to geocentric arrival times (i.e., corrected for the light-travel-time difference between the observatory and the Earth center), and the KM40m radio arrival times have been dedispersed to infinite frequency using the best-fit dispersion measure (DM). Top: the data points are the observed burst rates during the good time intervals (GTIs) of HXMT observations, and the step line is the burst rate estimated from the Bayesian blocks algorithm (see the main text). The inset panel shows the light curves of the MXB observed by HXMT and the RB observed by KM40m, respectively. The black dashed curve shows the best-fit FRED function to the HXMT data. Middle: the HXMT GTIs are marked by the shaded regions in blue. Bottom: the periods during which KM40m was monitoring SGR J1935 are denoted by the shaded areas in orange.
Other Images in This Article
Copyright and Terms & Conditions
© 2026. The Author(s). Published by the American Astronomical Society.