Image Details
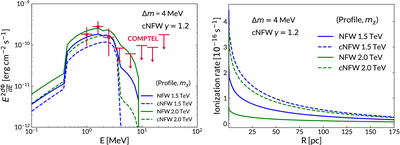
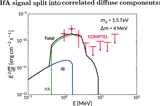
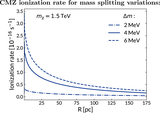
Caption: Figure 11.
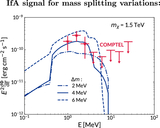
Left panel: IfA flux measurements from COMPTEL data (red points) compared to the prediction of the XDM model for the same scenarios. Right panel: CMZ ionization rate profile for the XDM model for the same scenarios. In both cases, the normalization is given by the cross sections σmr fit to the 511 keV line highlighted in Figure 10.
Other Images in This Article
Copyright and Terms & Conditions
© 2026. The Author(s). Published by the American Astronomical Society.
Copyright ©
2026 Astronomy Image Explorer. All Rights Reserved.