Image Details
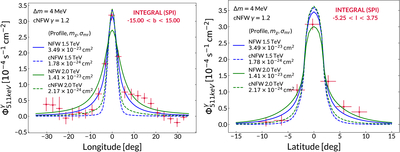
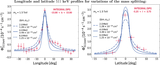
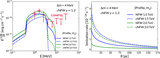
Caption: Figure 10.
511 keV longitude (left) and latitude (right) profiles for XDM models with mχ = 1.5 TeV (blue) and mχ = 2 TeV (green), and fixed mass splitting Δm = 4 MeV, compared to INTEGRAL/SPI data (red points). Solid lines correspond to an NFW profile, dashed lines to a cNFW profile. The best-fit values of σmr for each case are indicated in the legend.
Other Images in This Article
Copyright and Terms & Conditions
© 2026. The Author(s). Published by the American Astronomical Society.
Copyright ©
2026 Astronomy Image Explorer. All Rights Reserved.