Image Details
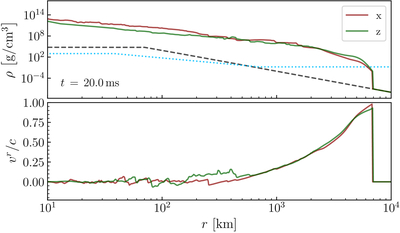
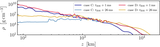
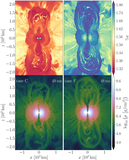
Caption: Figure 9.
Rest-mass density (top) and radial velocity (bottom) along the positive x- and z-axes at 20 ms after merger, for case A. Rest-mass density floor profiles in the top panel are shown as a black dashed line for our simulations and a light blue dotted line for K. Hayashi et al. (2024; see text).
Other Images in This Article

Copyright and Terms & Conditions
© 2026. The Author(s). Published by the American Astronomical Society.
Copyright ©
2026 Astronomy Image Explorer. All Rights Reserved.