Image Details
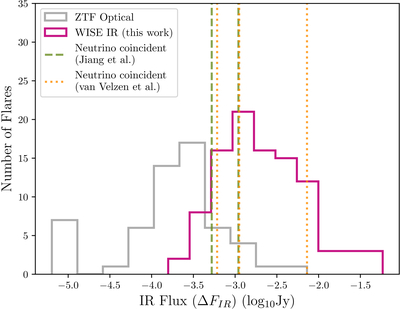
Caption: Figure 3.
Distribution of the IR flux of the mid-IR accretion flares identified in our analysis (magenta) and of the optical accretion flares (gray curve) considered by S. van Velzen et al. (2024). The vertical orange dotted lines and green dashed lines denote the flux of the TDE candidates reported to coincide with a neutrino event by S. van Velzen et al. (2024) and N. Jiang et al. (2023), respectively.
Other Images in This Article
Copyright and Terms & Conditions
© 2026. The Author(s). Published by the American Astronomical Society.
Copyright ©
2026 Astronomy Image Explorer. All Rights Reserved.