Image Details
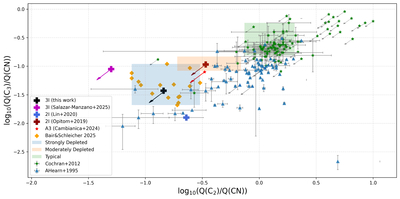
Caption: Figure 3.
Comparison between carbon depleted comets and 3I. Shaded areas represent the edges of various depletion levels defined in Table 5 of B&S25. Diamond-shaped data points are strongly depleted comets selected in their work. The A’Hearn data were taken from D. J. Osip & M. A’Hearn (2003).
Other Images in This Article
Copyright and Terms & Conditions
© 2026. The Author(s). Published by the American Astronomical Society.
Copyright ©
2026 Astronomy Image Explorer. All Rights Reserved.