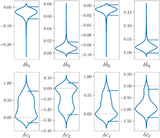
Image Details
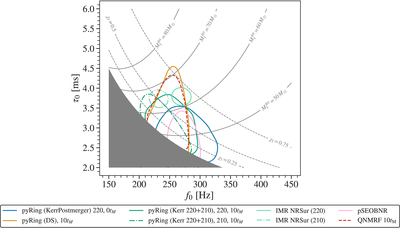
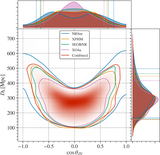
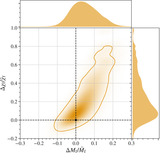
Caption: Figure 11.
Inferred frequencies and damping times of DSs or modes from models discussed in the text; see Section 3. The light-gray lines show the frequency and damping time of the (2, 2, 0) fundamental mode of a Kerr BH at various masses and spins. The dark-gray region corresponds to the frequencies and damping times that are inconsistent with a Kerr (2, 2, 0) fundamental mode. The light-green solid and dashed curves show the frequency and damping time of the Kerr (2, 2, 0) and (2, 1, 0) fundamental modes, respectively, for the remnant properties measured in our IMR analysis with the NRSur waveform model. We show results from an analysis using the pSEOBNR (Section 3.3) model in pink. The inferred frequency and damping time of the (2, 2, 0) fundamental mode in this analysis (also shown in Figure 10) are inconsistent with the same mode using estimates of the remnant properties from our IMR analysis. Analysis of the post-peak signal starting at t ∼ 10 tM using the pyRing pipeline with a single DS (Section 3.4) is shown in dark orange. The frequency from this analysis spans those inferred by the IMR analysis for the (2, 2, 0) and (2, 1, 0) modes, and the damping time is consistent with lower values. Analysis with the Kerr model, using both the (2,2,0) and (2,1,0) modes, is represented in dark green and shows that assuming that the two modes are present in the signal finds a lower damping time, more consistent with the pSEOBNR result. Analysis of the post-peak signal using the KerrPostmerger model (Section 3.4) starting at t = 0 tM is shown in blue. This model also finds a frequency and damping time for the (2, 2, 0) Kerr fundamental mode that are in tension with the IMR results. Analysis of the post-peak signal starting at t ∼ 10tM using the QNMRF (Section 3.5) to remove a single DS is represented in red and shows close agreement with the pyRing single DS model.
Other Images in This Article
Show More
Copyright and Terms & Conditions
© 2026. The Author(s). Published by the American Astronomical Society.