Image Details
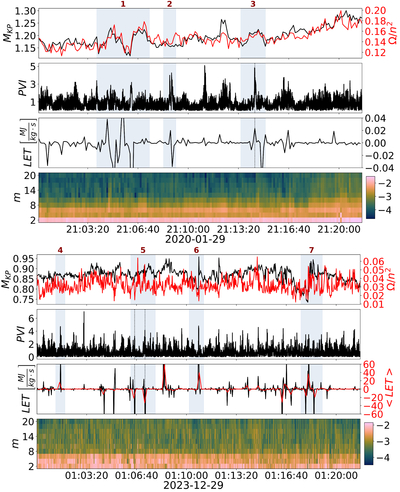
Caption: Figure 4.
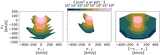
From top to bottom in each panel: Kaufmann–Paterson measure and normalized enstrophy, PVI, LET, and Hermite spectrogram for the wave stream (top) and the turbulent stream (bottom). The shaded areas highlight regions of interest described in the main text. The Hermite spectrograms are represented through the scientifically derived color map batlow (F. Crameri et al. 2020).
Other Images in This Article
Copyright and Terms & Conditions
© 2025. The Author(s). Published by the American Astronomical Society.
Copyright ©
2025 Astronomy Image Explorer. All Rights Reserved.