Image Details
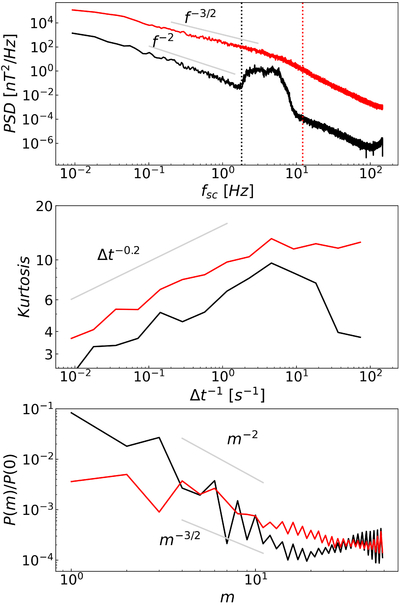
Caption: Figure 3.
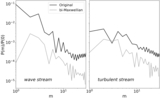
Top to bottom: power-spectral density of the magnetic field (top), kurtosis of the magnetic field (middle), and average Hermite spectrum (bottom) for the wave stream (black) and turbulent stream (red). In gray are typical reference slopes (these are not fits) to aid the eye. The slopes for the Hermite spectra are the ones from the S. Servidio et al. (2017) phenomenological model.
Other Images in This Article
Copyright and Terms & Conditions
© 2025. The Author(s). Published by the American Astronomical Society.
Copyright ©
2025 Astronomy Image Explorer. All Rights Reserved.