Image Details
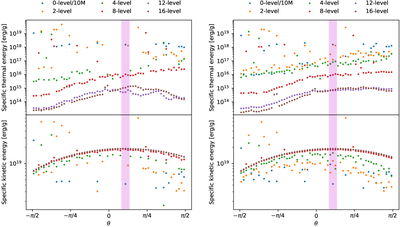
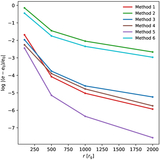
Caption: Figure 5.
Measuring the specific thermal and kinetic energies as a function of angular coordinate θ relative to the MBH as the leading edge of the tidal stream passes through pericenter. The pink region represents the estimated pericenter used in Section 3.2.1. Left: one snapshot with very few particles for the 0-, 2-, and 4-level simulations. Particles are only present in 13, 26, and 33 beams, respectively, of the 60 beams plotted. Right: the average of four adjacent snapshots, showing enough particles to meaningfully analyze in the lower-resolution simulations, with 25, 56, and 59 beams occupied for 0-, 2-, and 4-level simulations, respectively. Data are available on Zenodo at doi:10.5281/zenodo.17225834.
Other Images in This Article
Copyright and Terms & Conditions
© 2025. The Author(s). Published by the American Astronomical Society.