Image Details
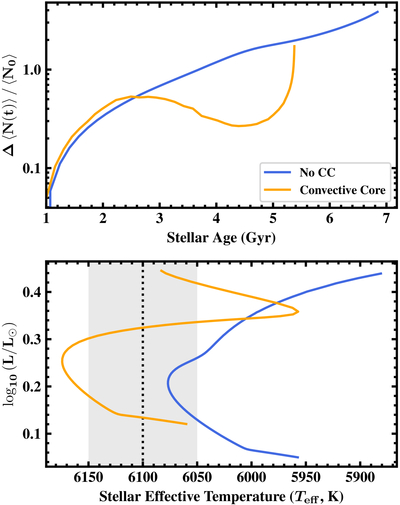
Caption: Figure 4.
Evolution of solar-composition MESA stellar models on either side of the convective-core transition. In both panels, the blue curves show the time evolution of 1.11 M⊙ stellar models, which do not exhibit a long-lived convective core on the main sequence, while the orange curves show those of 1.15 M⊙ stellar models, where a convective core persists throughout the main sequence until core hydrogen exhaustion. The upper panel shows the time evolution of the average Brunt–Väisälä frequency (or, equivalently, the g-mode undertone spacing), Equation (1), compared to a reference epoch of t0 = 1 Gyr, as in J. J. Zanazzi et al. (2024). The lower panel shows how these stellar models evolve on the Hertzsprung–Russell diagram.
Other Images in This Article
Copyright and Terms & Conditions
© 2025. The Author(s). Published by the American Astronomical Society.