

Image Details
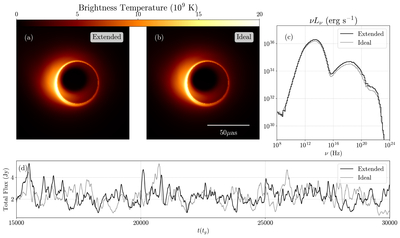
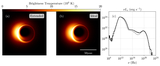
Caption: Figure 3.
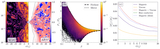
Electromagnetic observables for MAD a* = 15/16 simulation with Rhigh = 160 at a viewing angle of 30°. (a) and (b) Time-averaged 230 GHz total intensity images for the EGRMHD and IGRMHD simulations, respectively. (c) Comparison of time-averaged spectra for the simulations shown in (a) and (b). (d) Light curves at 230 GHz over a duration of Δt = 15,000 tg (∼84 hr for Sgr A*).
Other Images in This Article
Copyright and Terms & Conditions
© 2025. The Author(s). Published by the American Astronomical Society.

Copyright ©
2026 Astronomy Image Explorer. All Rights Reserved.
