

Image Details
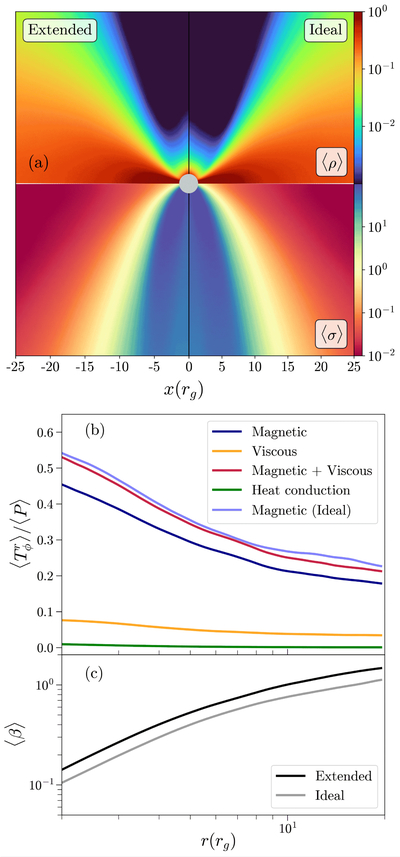
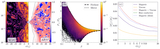
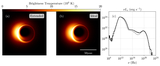
Caption: Figure 2.
Comparison of time-averaged fluid quantities between extended and ideal simulations (MAD, a* = 15/16). (a) The top row shows the time- and azimuthally averaged rest-mass density, ρ, and the bottom row displays plasma magnetization, σ. The left column shows the extended simulation, and the right column shows the ideal simulation. (b) Angular momentum transport in the disk: components of the density-weighted average ﹩\langle {T}_{\phi }^{r}\rangle ﹩ normalized by gas pressure 〈P〉 are plotted as a function of radius. (c) Radial profiles of β for extended and ideal simulations.
Other Images in This Article
Copyright and Terms & Conditions
© 2025. The Author(s). Published by the American Astronomical Society.

Copyright ©
2026 Astronomy Image Explorer. All Rights Reserved.
