Image Details
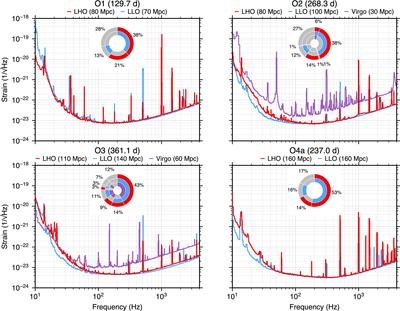
Caption: Figure 2.
Representative noise amplitude spectral densities for LHO, LLO, and Virgo during O1 (LHO, LLO: 2015 October 24), O2 (LHO: 2017 June 10; LLO: 2017 August 6; Virgo: from F. Acernese et al. 2023a), O3 (LHO: 2020 January 4; LLO: 2019 April 29; Virgo: 2020 February 9), and O4a (LHO: 2024 January 11; LLO: 2023 November 19). The BNS inspiral ranges, defined by Equation (1), for these noise curves are given in the legend. Inset sunburst charts show the fraction of the run duration during which different combinations of detectors were observing. Gray regions in each ring indicate portions when a detector is not operating. The segments of the sunburst chart, clockwise from 12 o’clock, are LHO–LLO, LHO alone, LLO alone, and neither for observing runs involving only LHO and LLO; and LHO–LLO–Virgo, LHO–LLO, LHO– Virgo, LLO–Virgo, LHO alone, LLO alone, Virgo alone, and none for observing runs involving LHO, LLO, and Virgo.
Other Images in This Article
Copyright and Terms & Conditions
© 2025. The Author(s). Published by the American Astronomical Society.