Image Details
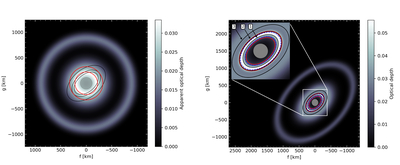
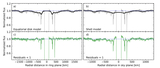
Caption: Figure 2.
Left: sky-plane projection of the shell model. The color map shows the optical depth ﹩\tau =-{\mathrm{ln}}\,(T)/2﹩ from three Gaussian-distributed spherical shells. The central gray circle (98 km radius) marks Chiron’s projected size; black ellipses indicate the confined rings; and red circles denote the Roche limits. Right: sky-plane view of the equatorial disk model. Optical depth ﹩\tau ={\tau }_{{\rm{N}}}/| \sin (B)| ﹩ is shown. The gray circle (98 km radius) marks Chiron. Black ellipses show the three narrow rings; dashed blue ellipses mark the 1/2 and 1/3 SORs; and red ellipses indicate Roche limits. Inset: zoom-in of the innermost region with rings Chi1R (1), Chi2R (2), and Chi3R (3).
Other Images in This Article
Copyright and Terms & Conditions
© 2025. The Author(s). Published by the American Astronomical Society.