Image Details
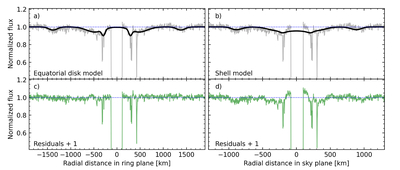
Caption: Figure 1.
Comparison between the equatorial disk and shell models. In the panels, the black curve represents the corresponding model compared to the observed light curve. (a) The time-based light curve is projected in the radial distance on the ring plane considering the preferred mean pole orientation. (b) The normalized flux as a function as the radial distance in the sky plane, compared with the model based in the consecutive spherical shells. The residuals plus 1 for the equatorial disk (c) and shell (d) models.
Other Images in This Article
Copyright and Terms & Conditions
© 2025. The Author(s). Published by the American Astronomical Society.
Copyright ©
2025 Astronomy Image Explorer. All Rights Reserved.