Image Details
Caption: Figure 3.
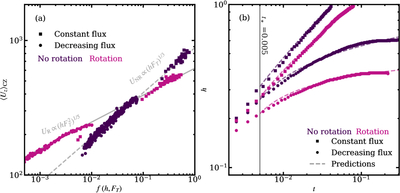
Panel (a): vertical component of the rms flow velocity, averaged over the convection zone, as a function of convection zone thickness h and imposed heat flux FT. The quantity plotted on the x-axis is f = hFT for the nonrotating case and ﹩f=h{F}_{T}^{2}﹩ for the rotating case. The dashed and solid lines represent the theoretical predictions from Equation (2) (with prefactors of 0.7 and 0.95, respectively, to obtain agreement with the measured values). Panel (b): thickness of the convection zone, h, as a function of time, t, for all our simulations. The vertical line marks t⋆ = 0.005, the time at which the cooling flux at the top boundary begins to decrease with time. The dashed lines correspond to the analytic predictions in Equations (4)–(7), with best-fit values γ = 0.58, 1.9, 0.41, 0.022 from top to bottom.
Other Images in This Article
Copyright and Terms & Conditions
© 2025. The Author(s). Published by the American Astronomical Society.