Image Details
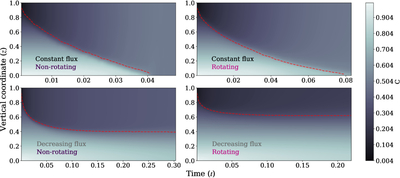
Caption: Figure 2.
Color maps showing the evolution of the horizontally averaged composition over time. In each case, the red dashed line shows the measured location of the convection zone boundary.
Other Images in This Article
Copyright and Terms & Conditions
© 2025. The Author(s). Published by the American Astronomical Society.
Copyright ©
2025 Astronomy Image Explorer. All Rights Reserved.