Image Details
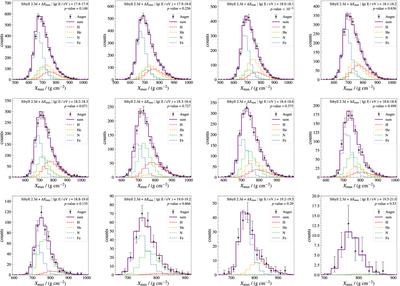
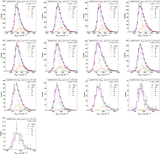
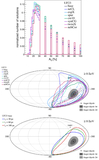
Caption: Figure 7.
Distributions of Xmax obtained from fits in each energy bin using the model SIBYLL 2.3d + ΔXmax. The plot shows the total fit (sum) alongside the individual contributions of particle species. The p-value of the fit and the energy bin for which the fit is performed are indicated in each panel.
Other Images in This Article
Copyright and Terms & Conditions
© 2025. The Author(s). Published by the American Astronomical Society.
Copyright ©
2025 Astronomy Image Explorer. All Rights Reserved.