Image Details
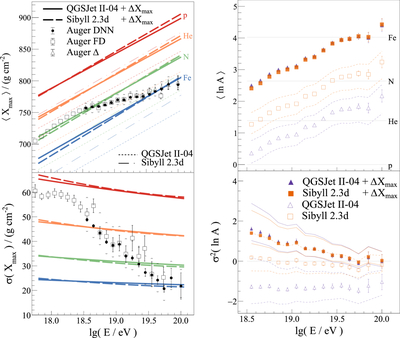
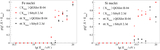
Caption: Figure 1.
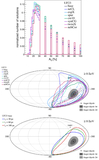
Left panel: the energy evolution of the mean and standard deviation of Xmax for data (C. J. Todero Peixoto 2019; A. Yushkov 2019; A. Abdul Halim et al. 2025a) measured by the Pierre Auger Observatory (black), including the systematic uncertainty in the case of Auger DNN (brackets). The original model predictions for four primary species are depicted by thin lines and the adjusted predictions by thick lines. Right panel: the energy evolution of the two lowest moments of ﹩\mathrm{ln}A﹩, interpreted from the Auger DNN data shown in the left panel, using the adjusted (filled markers) and original (open markers) model predictions.
Other Images in This Article
Copyright and Terms & Conditions
© 2025. The Author(s). Published by the American Astronomical Society.