Image Details
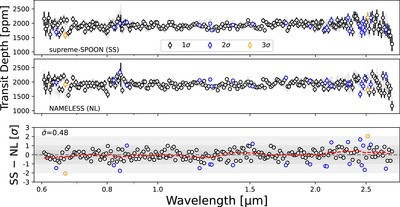
Caption: Figure 3.
Comparison between supreme-SPOON and NAMELESS transmission spectra. Top: supreme-SPOON transmission spectrum with points colored by their deviation from the NAMELESS spectrum. Black points are consistent between the two spectra at a 1σ level, blue points at 2σ, etc. Sigma levels are calculated using the maximum error bar between the two spectra for each wavelength bin. The NAMELESS spectrum is also shown in faded points. Middle: same as the top panel but for the NAMELESS spectrum. Bottom: differences in each spectral bin divided by the maximum error bar of the two reductions. The red dashed line is a running median showing that there are no low-frequency trends. The average deviation between the two spectra is 0.48σ.
Other Images in This Article


Copyright and Terms & Conditions
© 2024. The Author(s). Published by the American Astronomical Society.