Image Details
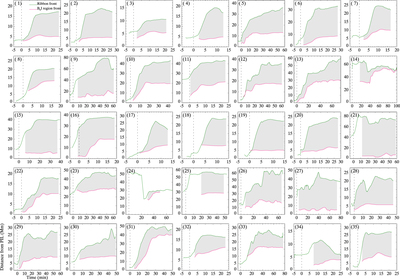
Caption: Figure 4.
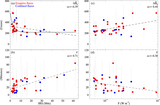
Evolution of the distances from the region’s fronts to the flaring PILs in all cases, with red (green) for the B h -increase region (flare ribbons). The subcaptions indicate case numbers in Table 1. The vertical lines mark the flare’s start. The shaded regions mark the coexistence duration of the B h increase and flare ribbons.
Other Images in This Article
Copyright and Terms & Conditions
© 2022. The Author(s). Published by the American Astronomical Society.
Copyright ©
2026 Astronomy Image Explorer. All Rights Reserved.