Image Details
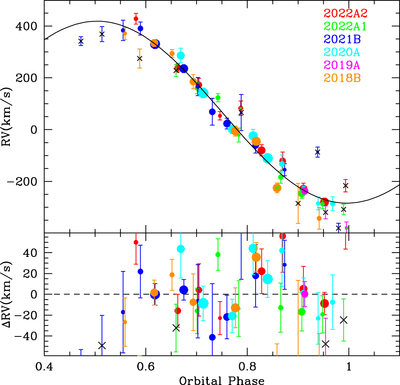
Caption: Figure 3.
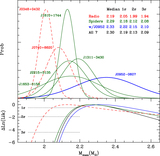
RV measurements for J0952. Dot size is proportional to the correlation coefficient R; low-significance correlations with R < 2 are marked with black crosses and are excluded from all fits. Three higher-significance points marked with green crosses appear as outliers and are optionally excluded for the “trimmed” fit. The background curve is the best-fit RV curve for the heating model fit to the light curve in Figure 1. The lower panel shows the fit residuals.
Other Images in This Article
Copyright and Terms & Conditions
© 2022. The Author(s). Published by the American Astronomical Society.
Copyright ©
2026 Astronomy Image Explorer. All Rights Reserved.