Image Details
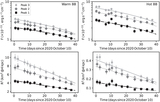
Caption: Figure 2.
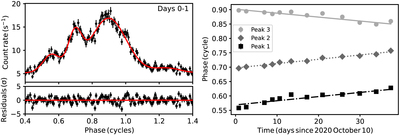
Upper-left panel. The SGR 1830−0645 pulse profile, shown as black points with corresponding uncertainties as solid vertical bars, derived from the first day of NICER observations at outburst onset (i.e., 2020 October 10). The red solid line represents the best-fit four-Gaussian model to the data. Lower-left panel. Residuals from the best-fit model in terms of σ. Right panel. Temporal evolution of the best-fit Gaussian centroids to the three peaks in the SGR 1830−0645 pulse profiles (the corresponding 68% uncertainties are smaller than the symbol size). All three peaks follow a similar linear trend with an absolute rate of about (1.5 ± 0.1) × 10−3 cycle day−1. Note the opposite motion of peak 3, the brightest, compared to the other two. See text for more details.
Other Images in This Article
Copyright and Terms & Conditions
© 2022. The Author(s). Published by the American Astronomical Society.