Image Details
Caption: Figure 1.
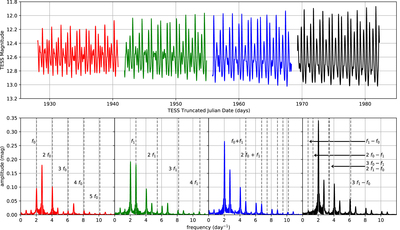
Top panel: the full lightcurve of V338 Boo. Bottom panels: frequency analysis of the color-coded segments from the top plot. Dashed lines and text label the locations of various peaks, with f0 and f1 corresponding to the fundamental and first overtone frequencies, respectively.
Other Images in This Article
Copyright and Terms & Conditions
© 2021. The American Astronomical Society. All rights reserved.
Copyright ©
2026 Astronomy Image Explorer. All Rights Reserved.