Image Details
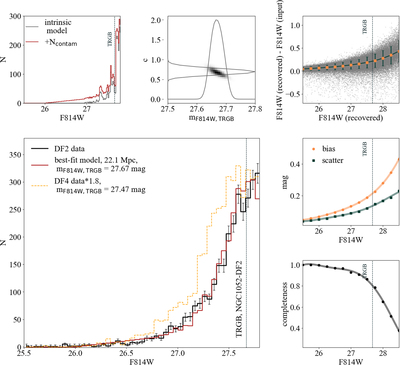
Caption: Figure 4.
TRGB forward modeling results for NGC 1052–DF2. Top-left panel: the F814W luminosity function of the intrinsic model without contamination (gray) and with contamination added (red). Top-middle panel: the likelihood map from 1000 Monte Carlo runs, marginalized over the TRGB magnitude mTRGB,F814W and the contamination parameter c, as defined in Equation (1). The parameter values at maximum likelihood are used to construct the best-fit model in the main panel. Top-right panel: the systematic offset (bias, in orange) and the scatter (in green) in the recovered magnitudes using the artificial star test. Middle-right panel: the bias and scatter from the top-right panel, fitted with a fifth-order polynomial. Bottom-right panel: photometric completeness, the fraction of input artificial stars that are recovered at each magnitude. Main panel: the best-fit model (red) of the observed F814W luminosity function (black), with a TRGB magnitude of mTRGB,F814W = 27.67 from the maximum likelihood. The best-fit model is the intrinsic luminosity function with contamination added (shown in the top-left panel) and photometric errors applied (shown in the right panels). The reduced χ2 value for this fit is 1.8. For comparison, the observed luminosity function of NGC 1052–DF4 (Danieli et al. 2000) is scaled and plotted in the dashed yellow line.
Other Images in This Article
Copyright and Terms & Conditions
© 2021. The American Astronomical Society. All rights reserved.