Image Details
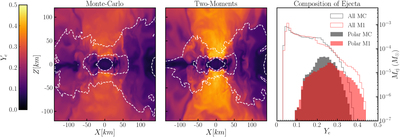
Caption: Figure 3.
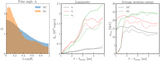
Left panel: electron fraction of the remnant 5 ms after merger in the MC simulation with the highest packet count. Dashed white lines are density contours at ﹩{10}^{\mathrm{9,11,13}}\,{\rm{g}}\,{\mathrm{cm}}^{-3}.﹩ Middle panel: the same, for the M1 simulation. Regions just outside of the neutron star and disk are slightly denser in the MC simulations (possibly due to he higher νx luminosity), and matter is more neutron rich in the outflow regions. Right panel: composition of the unbound material. Filled histograms shows the polar outflows only.
Other Images in This Article
Copyright and Terms & Conditions
© 2020. The American Astronomical Society. All rights reserved.
Copyright ©
2026 Astronomy Image Explorer. All Rights Reserved.