Image Details
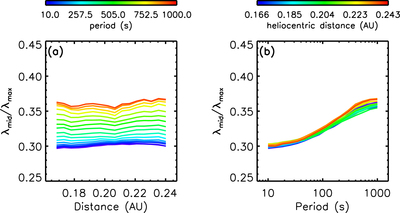
Caption: Figure 5.
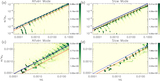
Panel (a): the distance profiles of the ratio between the middle and maximum singular values of the magnetic spectral matrix (λmid/λmax) for the magnetic fluctuations at different periods from 10 to 1000 s. Panel (b): the variations of λmid/λmax with period for the magnetic fluctuations at different distances from 0.17 to 0.24 au.
Other Images in This Article
Copyright and Terms & Conditions
© 2020. The American Astronomical Society. All rights reserved.
Copyright ©
2026 Astronomy Image Explorer. All Rights Reserved.